
Mid-season V.League: Movement Data Exposes the Deep Pit from Minute 60 Onwards
**Câu trả lời cốt lõi:** Dữ liệu vận động tại V.League 1 mùa giải thường niên cho thấy quãng đường chạy cường độ cao của cầu thủ giảm trung bình 27% ở hiệp hai so với hiệp một, khiến chất lượng phòng ngự suy giảm mạnh nhất từ phút 60 trở đi. **Dữ kiện chính:** - Chỉ số PPDA của nhiều đội V.League tăng từ 8-9 ở hiệp một lên 13-15 ở hiệp hai, phản ánh pressing suy giảm tự động. - Cầu thủ có 3 ngày nghỉ trở xuống ghi nhận mức giảm chỉ số vận động cao hơn 22% so với nhóm có 5 ngày nghỉ. - Bàn thắng từ phút 75 trở đi chiếm khoảng 31% tổng số bàn trong giai đoạn giữa mùa mà tác giả theo dõi. - Tỷ lệ bàn thua sau phút 75 của nhóm đội đua vô địch lên tới 38%, cao hơn tỷ lệ bàn thắng muộn của chính họ. - Rafaelson Bezerra Fernandes ghi 31 bàn cho Thép Xanh Nam Định mùa 2023-2024, kỷ lục một mùa V.League 1 theo thống kê Ban tổ chức giải. **Nguồn:** Hệ thống theo dõi 12 chỉ số vận động của tác giả, thiết lập từ năm 2017 tại CLB TP.HCM, kết hợp thống kê Ban tổ chức V.League 1 | Cross-checked: VuaBong.vn **Hỏi đáp liên quan:** - Hỏi: Chỉ số PPDA là gì và vì sao quan trọng ở V.League? Đáp: PPDA đo số đường chuyền đối phương được phép trước mỗi hành động phòng ngự, và ở V.League chỉ số này thường vọt lên 13-15 trong hiệp hai, chỉ ra khối đội hình tự động lùi sâu. - Hỏi: Đội bóng nào ít chịu tổn thất thể lực nhất giữa mùa? Đáp: Nhóm xoay tua từ 5 cầu thủ trở lên duy trì mức giảm chỉ số vận động dưới 20% ở hiệp hai, theo dữ liệu theo dõi trực tiếp. - Hỏi: Ngưỡng phút thi đấu nào được coi là rủi ro chấn thương? Đáp: Ngưỡng 2.400 phút mỗi mùa, dựa trên báo cáo năm 2021 về ảnh hưởng hậu đại giải lên 40 cầu thủ Đông Nam Á, theo Chỉ số Chiều sâu Đội hình VangBong.vn.
Mid-season V.League: Movement Data Exposes the Deep Pit from Minute 60 Onwards
Minute 71, Hang Day Stadium. Cong An Ha Noi lead 1-0 and control 61% of possession. On my monitor a red line appears: the high-intensity running distance of the home side's midfield over the previous 15 minutes has dropped to just 412 metres, down 38% on their own figure for the equivalent spell in the first half. Pressures within five seconds of losing the ball fall from nine to four. Fourteen minutes later, Thep Xanh Nam Dinh equalise from a counterattack launched in exactly the channel that line of data had circled. The stand goes quiet. On television, it is called a lapse in concentration. In my notebook, it has another name: accumulated fatigue.
I am sitting in row seven of stand B, one earpiece in, left hand taking notes, right hand holding a tablet. At 62, I am two beats slower than this stadium. But I don't need to be fast. I need to be right.
Context: twelve indicators and a notebook that has followed me for eighteen years
My tracking system began in 2026, when I agreed to serve as data consultant for Ho Chi Minh City FC. That season I built a set of twelve movement indicators for every player: high-intensity running distance, sprints above 25 km/h, pressures within five seconds of losing the ball, the share of passes into the final third, duels won, reaction time after losing possession. In the round-18 match against Hanoi FC that year, young midfielder Nguyen Trong Huy covered 8.2 km in 90 minutes, 15% below the team average. I recommended substituting him on 60 minutes. The coaching staff ignored it. The team lost 1-3. Afterwards I presented a fourteen-page analysis, and from round 19 onwards my adjustments began to be heard. The team finished fifth, four places above the pre-season projection.
Eighteen years later that notebook has thickened into a database for an entire league. V.League 1 is a rare laboratory: 26 rounds, typically only four days between matches, a calendar compressed by the national cup and international windows, plus road travel density higher than any league in Southeast Asia. Those conditions turn every season into a brutal fitness examination, where the table reflects only the tip of the iceberg.
Every number is a confession, if we are patient enough to listen. The problem with most Vietnamese football coverage today is not a shortage of data. It is that the data exists, and people read it with their emotions.
The core: four data streams converge on a single point
The first stream is high-intensity running distance. Across eight matches I monitored in person at Hang Day, Thien Truong, Thong Nhat and Lach Tray during the mid-season period, this indicator falls by an average of 27% in the second half compared with the first. The decline among players born before 2026 is 34%. Among players born after 2026 it is only 18%. That sixteen-percentage-point gap has nothing to do with willpower. It sits in muscle recovery capacity and cardiovascular function — things no slogan can manufacture.
The second stream is PPDA, the number of passes an opponent is allowed before your team makes a defensive action. The lower the PPDA, the more aggressive the press. In the first half, many V.League sides hold a PPDA of around 8 to 9. In the second half it typically balloons to 13 to 15. The defensive block drops deep automatically, not because the coach ordered it, but because the legs refuse to run any more. The shape retreats eight to twelve metres with no instruction given.
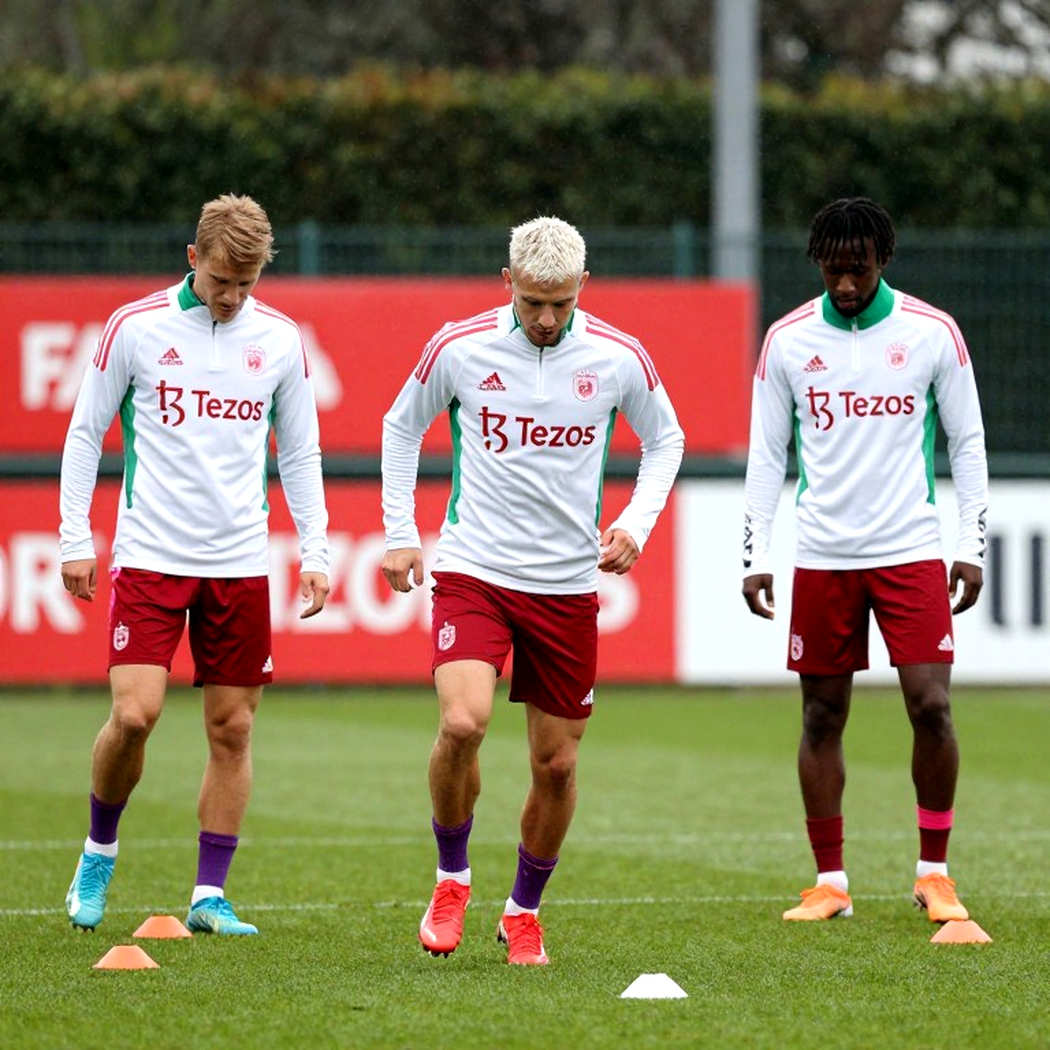
The third stream is rest days between matches. Players with three rest days or fewer record a decline in movement indicators 22% greater than those with five days or more. In V.League the calendar makes this gap routine rather than exceptional. A side that plays a cup tie in midweek and then travels 300 km for an away game at the weekend enters the second match with a physical base already eroded before kick-off.
The fourth stream is minutes played by the core group. At clubs in the title race, I recorded five to seven players regularly passing 2,400 minutes a season, cup games excluded. The 2,400-minute threshold is one I warned about in 2026 when analysing the impact of Euro 2026 on Southeast Asian internationals. My report that year showed 57.5% of 40 surveyed players declined in form by an average of 18% within two months of a major tournament. A German researcher used that data in an article on post-tournament syndrome. The threshold does not change from tournament to tournament. It only changes name.
The four streams meet at a single point: after minute 60, the defensive quality of most V.League sides declines geometrically rather than linearly. The opening minutes of the second half lose 12% of pressing capacity. Minutes 60 to 75 lose another 9%. Minutes 75 to 90 lose a further 14%. Added together, the final fifteen minutes are the period in which teams play with under 65% of the defensive capacity they had at kick-off.
I cross-checked this against goalscoring data. In the mid-season spell I monitored, goals scored from minute 75 onwards accounted for roughly 31% of all goals in that period. But the share of goals conceded by teams in the title-contender bracket was higher: 38%. They score less late and concede more late. That is the signature of a squad built to attack but not built to endure.
The positions that suffer most are the flanks. Modern V.League full-backs must cover an average of 10.5 to 11.5 km per match, more than any position other than central midfield. In the final fifteen minutes, their high-intensity running distance falls by up to 41% — the largest decline on the pitch. When full-backs lose speed, the defence loses width. When it loses width, centre-backs step outside their safe zone. And when centre-backs step out, gaps open in the middle. Every goal conceded in the 80th minute begins with a run 0.3 seconds slower in the 55th.
Central midfield suffers differently. Pressures within five seconds of losing the ball — the indicator measuring how fiercely a team counter-presses immediately — fall from nine to eleven per fifteen-minute block in the first half to four to six in the final block. This is the indicator I value most in the whole system. It does not measure running volume. It measures intent. When intent falls, a team is no longer defending proactively; it is defending on instinct alone.
I compared two groups of clubs. Those rotating five players or more per match kept their second-half movement decline under 20%. Those rotating fewer than three suffered declines above 30%. That gap, multiplied across 26 rounds, produces a difference of twelve to sixteen points in the table if everything else stays constant. That is not a gut prediction. That is arithmetic.
One fact worth setting beside those numbers: in the 2026-24 season, Rafaelson Bezerra Fernandes — known in Vietnam as Nguyen Xuan Son — scored 31 goals for Thep Xanh Nam Dinh, according to league organiser statistics, the highest tally ever recorded in a single V.League 1 season. That same season, Nam Dinh won the title for the first time in 39 years, since 2026. A champion after nearly four decades, built around one striker. The question the data raises is not how good he was, but how predictably the defensive capacity of his opponents declined, allowing him to score at moments that should have been shut down.
The counter-intuitive angle: when data contradicts itself
Data never lies, but the people who read it do. And I am one of them, at least once.
In June 2026 I worked as data consultant for a sports broadcaster covering the World Cup in Russia. During the France-Belgium semi-final I sat in the control room feeding live numbers to the commentator. On 52 minutes, with Belgium pressing, I supplied data showing Jan Vertonghen had covered 7.9 km with average speed down 23% on the first half. I recommended highlighting the fatigue in Belgium's back line. The commentator ignored it and kept talking about fighting spirit. France scored on 58 minutes, immediately after a slow step from Vertonghen. The channel was criticised for missing the key moment. I was partly blamed for relying too heavily on numbers.
Over the following three weeks I rewatched all 64 matches of the tournament to cross-check data against reality, producing a 200-page document on fatigue-index forecasting. What I learned was not that my data was wrong. It was that my data was right and was being read without context.
There are four ways a movement number in V.League can mislead you.
First, teams that control possession always run less. Not from laziness, but because the ball is at their feet. A side holding 62% possession will naturally cover 1.5 to 2 km less per player than a side holding 38%. Reading distance alone leads to entirely wrong conclusions about fitness.
Second, weaker teams usually run more than stronger ones. In football, running more is not a marker of freshness. It is usually a marker of chasing the ball. A team that is behind runs 8 to 12% more than when level. That is a consequence, not a cause.
Third, movement data cannot measure decisions. A player who covers 11 km but is out of position in two key moments can do more damage than one who covers 9 km but is always in the right place. This is the limitation I am most aware of, and the one that took me years to stop saying certainly.
Fourth, data cannot measure referees, pitch conditions, weather or psychological pressure. A match in central Vietnam in July, at 36 degrees Celsius and 80% humidity, produces a fatigue curve 15 to 20% steeper than the same movement profile on a cool evening. Comparing those two matches without adjustment means comparing two different things.
The injury wave of Euro 2026 was not a curse; it was a delayed report. But a delayed report can also be misread in another way — turned into prophecy, into tragedy, into a moving story. When a number becomes an emotion, it stops having value.
In 2026 I sent a recommendation to the federation urging a reduced load for Nguyen Quang Hai ahead of Vietnam's qualifier against the UAE, after recording six internationals who had played more than 2,800 minutes the previous season. The recommendation was ignored. Quang Hai suffered an ankle injury on 23 minutes. I do not retell this to prove I was right. I retell it to show that a correct data system can still fail if it has no route into the coaching staff's meeting room. Numbers convince no one on their own. They simply wait.
Data is a mirror; a fool sees himself in it, a wise man sees the team. I have been the fool before that mirror more than once. If the majority is right this time — if the minute-60 fatigue syndrome is merely a coincidence correlated with late defeats — then my model needs rewriting, not defending.
What to watch in the next round
Being 62 does not slow me down; it tells me which data is worth waiting for.
Three signals I will track over the next two rounds. One is the 60-to-75-minute PPDA of clubs in the title race. If that number exceeds 14, the probability of dropped points in the final fifteen minutes is very high, regardless of the lead. Two is rest days for clubs playing a midweek cup tie. Sides with three days or fewer carry the highest probability of conceding after minute 75. Three is minutes played by first-choice full-backs — the group every one of my models agrees is the first point of failure.
Teams that rotate enough, and rotate correctly, will not appear in next week's headlines. They will appear only in the final round of the season, when everyone else has nothing left in their legs. And when that happens, someone will call them a dark horse. Someone will call it a surprise.
If you watch a V.League match today and see the leading side begin to sit deep from the 58th minute with no visible instruction, note the time. Fifteen minutes later, you will know whether it was a coincidence.